Instruction
Read on to learn about how hearing loss is measured and the different grades of hearing loss.
How to measure hearing loss
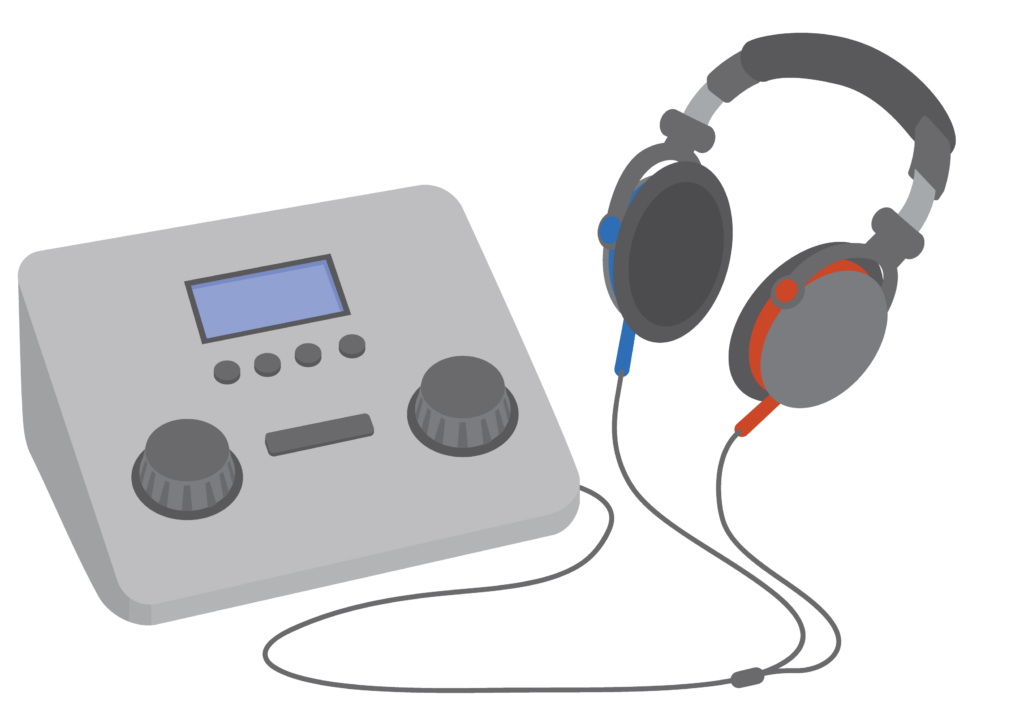
Hearing loss is measured using an audiometer.
An audiometer measures sound volume in decibels (dB).
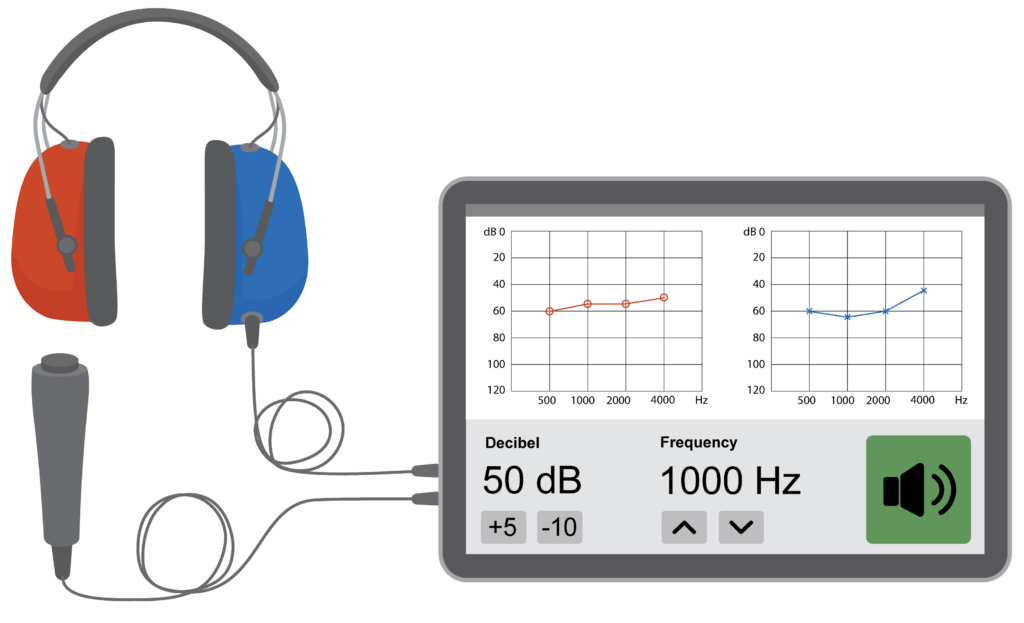
Hearing test (audiometry)
Tests how well a person hears sounds. This includes how well a person can hear different types of sound and how loud or quiet sounds are.
Instruction
In this module audiometry is referred to as a hearing test.

Audiogram
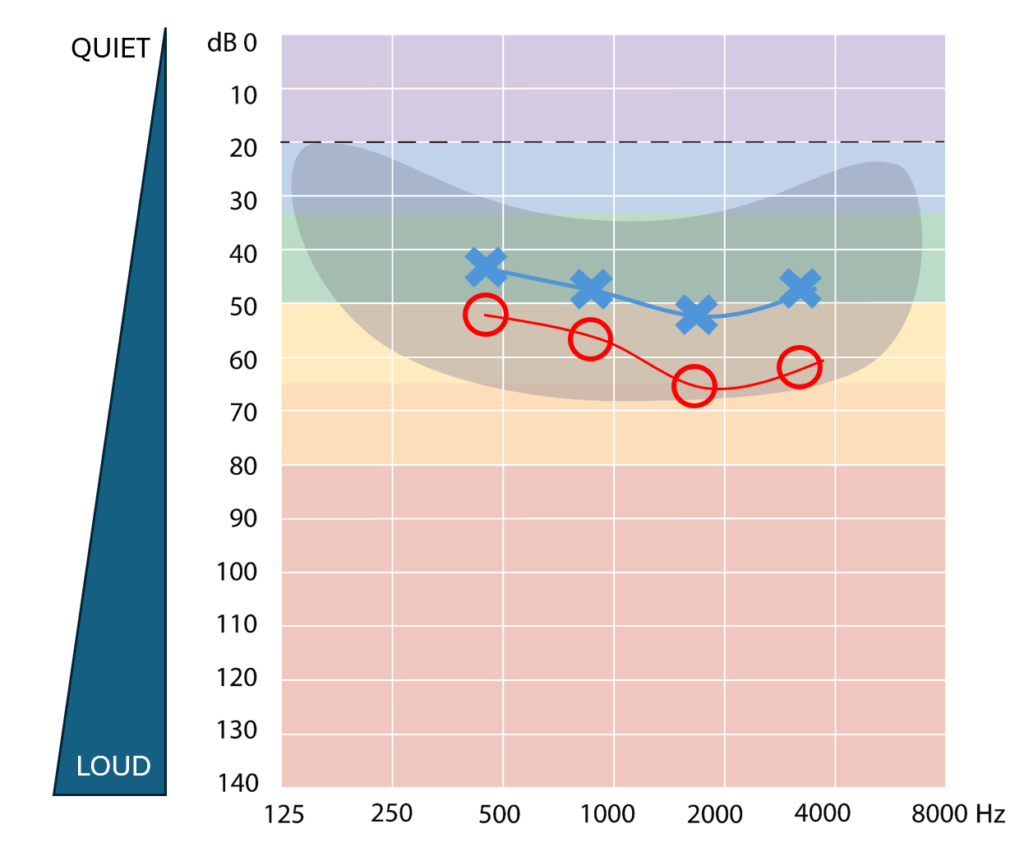
The hearing test results are shown in an audiogram.
An audiogram shows the quietest sound that a person can hear (hearing threshold) at different frequencies of sound.
- Frequency (hertz) is shown with low frequency sounds on the left and high frequency on the right
- Loudness (decibels) is shown with quiet sounds at the top and loud sounds at the bottom.
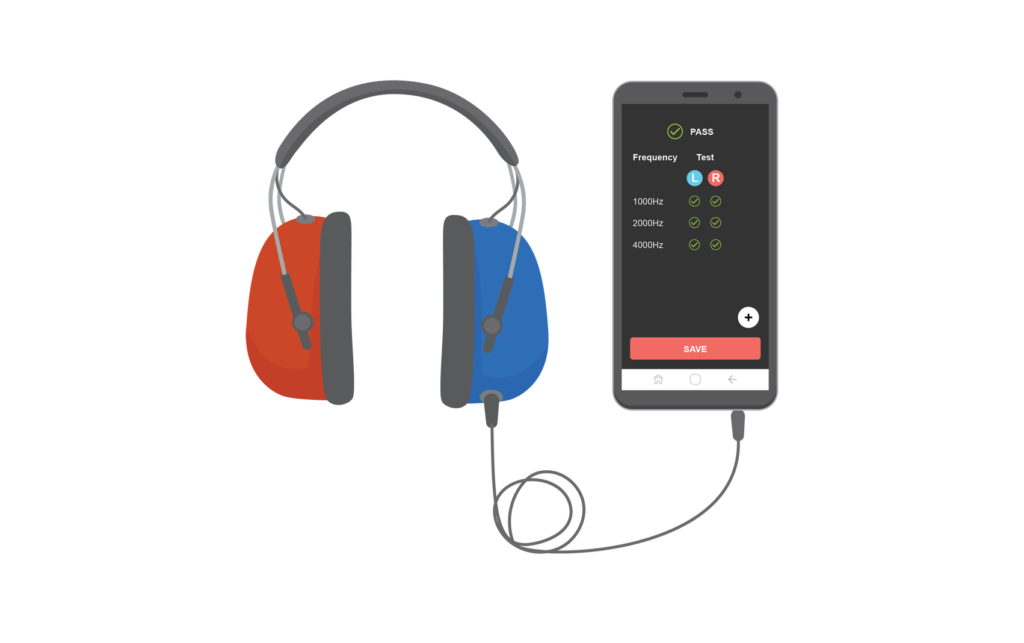
Results for each ear are shown differently:
- Red or circles for right ear
- Blue or crosses for left ear.
Results may be in two separate audiograms for right and left or in one audiogram.
Different types of sounds (frequency)
Different types of sound (frequency) are measured in hertz (Hz).
- Examples of high frequency sounds include a whistle and birds singing
- Examples of low frequency sounds are a drum and chainsaw.
Question
Look at the pictures on the audiogram.
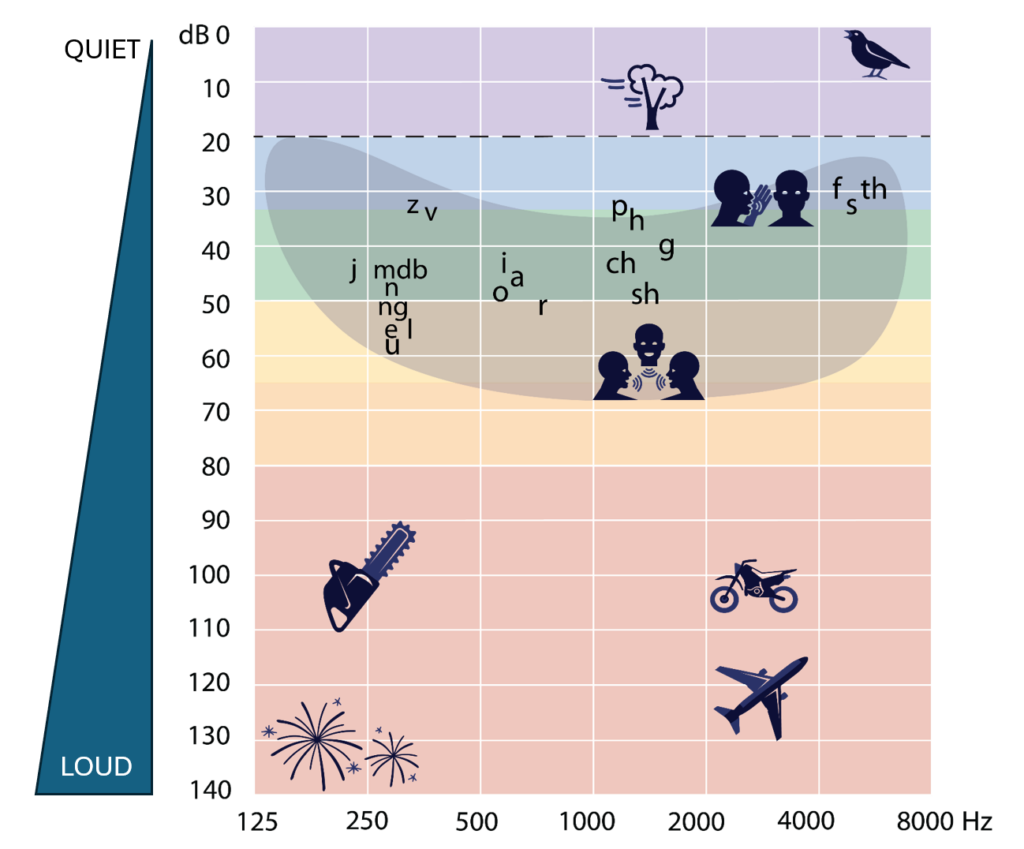
Which picture shows a high frequency and loud sound?
Motorcycle is correct!
- A motorcycle is a high frequency loud sound
- A chainsaw is a low frequency loud sound
- Falling leaves is a medium frequency quiet sound
- Birds singing is a high frequency quiet sound.
‘Speech banana’
![]()
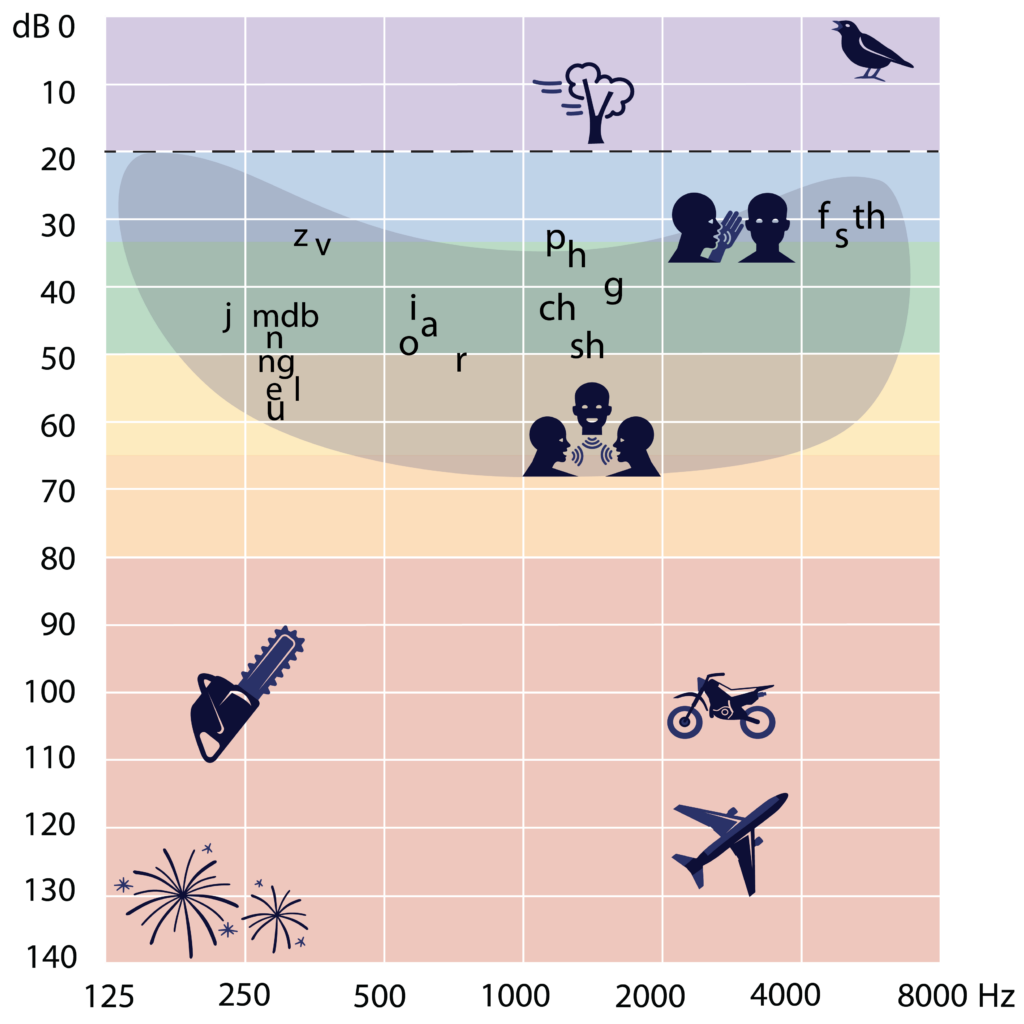
The banana shaped area on the audiogram shows speech sounds at conversation level.
The sounds in our speech have low, medium and high frequency sounds.
If a person has hearing loss, they may hear some speech sounds and not others. This makes it harder to understand what a person is saying.
As hearing loss increases it becomes more difficult to hear conversations in a normal speaking voice.
Grades of hearing loss
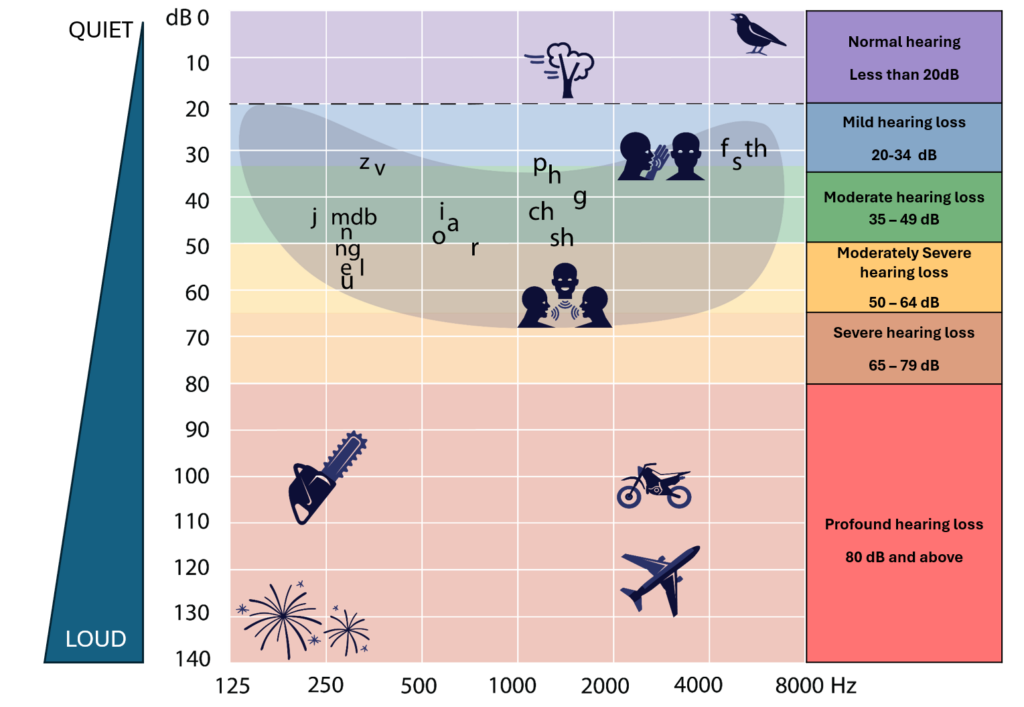
People with hearing loss cannot hear as well as people with normal hearing.
The results of a hearing test can be graded to six different levels for each ear. The grades are based on average hearing thresholds for each ear:
- Normal hearing
- Mild hearing loss
- Moderate hearing loss
- Moderately severe hearing loss
- Severe hearing loss
- Profound hearing loss
Remember John?

John retired after working in a noisy factory for 34 years.
He has a hearing test at his local health service. The health worker shows John his hearing test results and explains he has severe hearing loss in both ears.
The health worker explains that John may find it difficult to hear conversations.
Instruction
Learn how to calculate average hearing thresholds in Lesson two.