Maelekezo
Soma ili ujifunze kuhusu namna Kupotea kwa usikivu kunavyopimwa na viwango tofauti vya Kupotea kwa usikivu.
Namna ya kupima kiwango cha Kupotea kwa usikivu
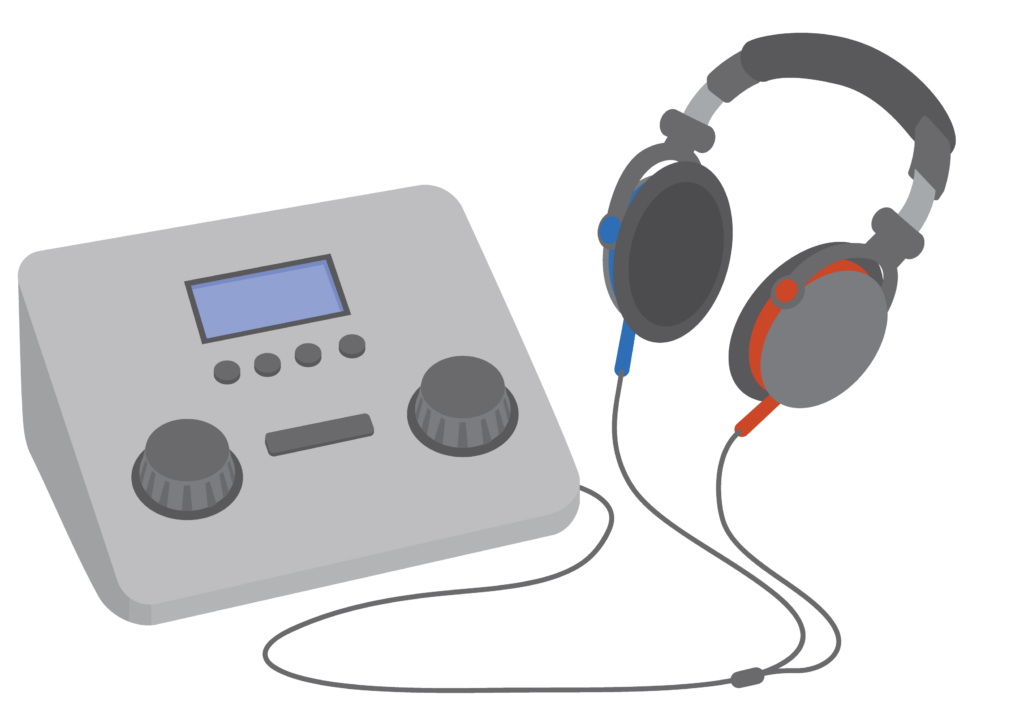
Kupotea kwa usikivu hupimwa kwa kutumia kipima sauti.
Kipima sauti hupima kiasi cha sauti katika desibeli (dB).
Kipimo cha kusikia (Odiometri)
Hupima namna mtu anavyosikia sauti vizuri. Hii ni pamoja na namna mtu anavyoweza kusikia aina tofauti za sauti na namna sauti zilivyo na kiwango kubwa au kiwango cha chini.
Maelekezo
Katika Moduli hii Odiometri inajulikana kama kipimo cha kusikia.
Odiogramu
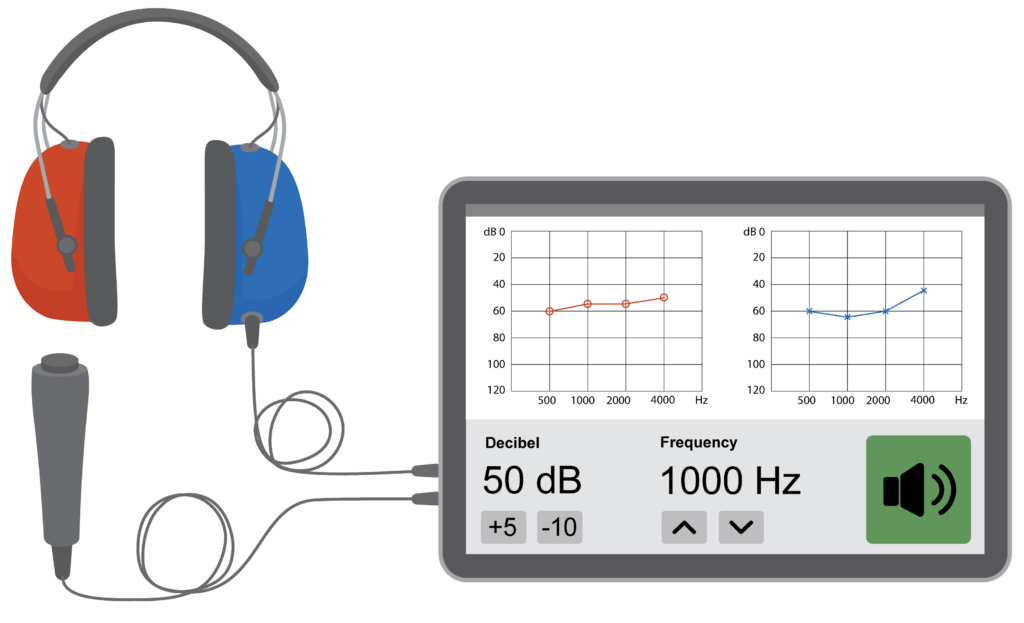
Matokeo ya kipimo cha kusikia yanaonyeshwa kwenye Odiogramu.
Odiogramu inaonyesha sauti ya chini kabisa ambayo mtu anaweza kusikia (kiwango kidogo kabisa kinachosikika) katika masafa tofauti ya sauti.
- masafa (hezi) yanaonyeshwa kwa sauti za masafa ya chini upande wa kushoto na masafa ya juu upande wa kulia
- sauti kubwa (desibeli) inayoonyeshwa kwa kutumia sauti ya chini iliyo upande wa juu na sauti kubwa sana iliyo upande wa chini.
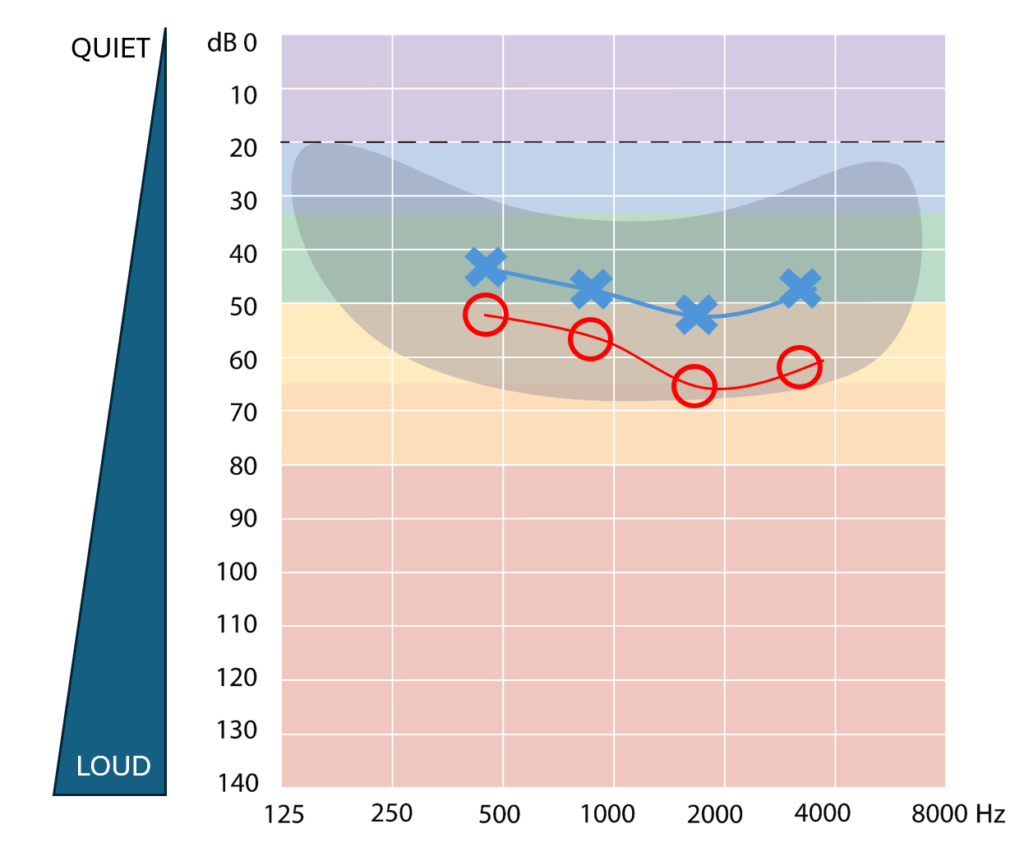
Matokeo ya kila sikio yanaonyeshwa tofauti:
- Nyekundu au miduara kwa sikio la kulia
- Bluu au misalaba kwa sikio la kushoto.
Matokeo yanaweza kuwa katika odiogramu mbili tofauti kwa kulia na kushoto au katika odiogramu moja.
Aina tofauti za sauti (masafa)
Aina tofauti za sauti (masafa) hupimwa katika hezi(Hz).
- Mifano ya sauti za masafa ya juu ni pamoja na filimbi na kuimba kwa ndege
- Mifano ya sauti za masafa ya chini ni ngoma na msumeno.
Swali
Angalia picha zilizo kwenye odiogramu.
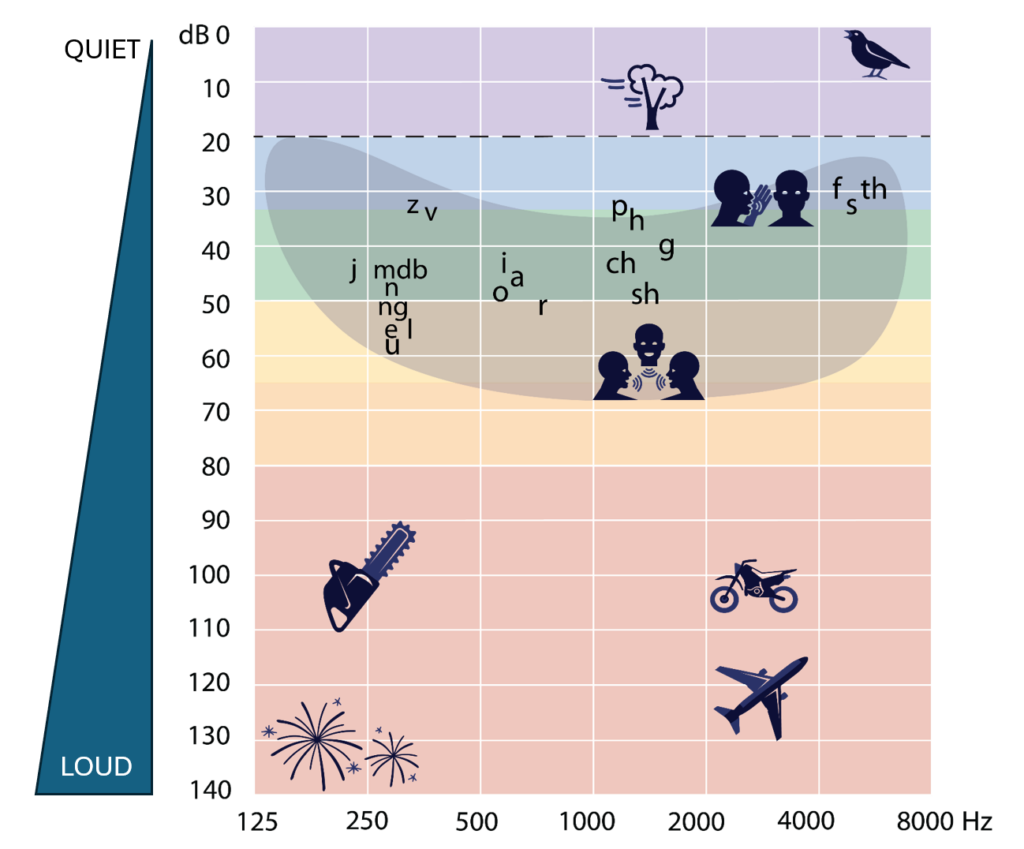
Je, ni picha gani inayoonyesha masafa ya juu na sauti kubwa?
Pikipiki ni sahihi!
- Pikipiki inatoa sauti kubwa ya masafa ya juu
- Msumeno unatoa sauti kubwa ya masafa ya chini
- Majani yanayoanguka yanatoa sauti ya utulivu ya masafa ya kati
- Ndege wanaoimba wanatoa sauti ya tulivu ya masafa ya chini.
'Mlio wa sauti mithili ya umbo la ndizi'
![]()
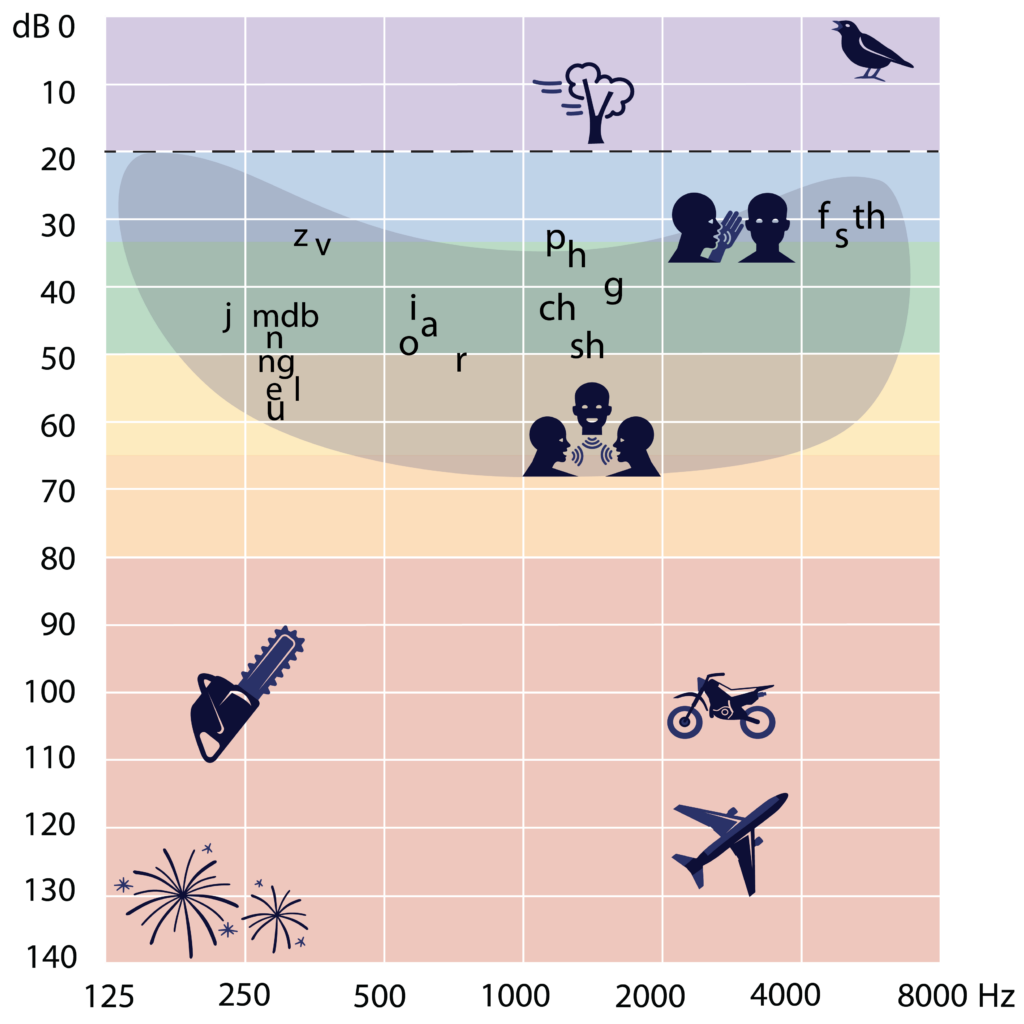
Eneo lenye umbo la ndizi kwenye odiogramu huonyesha sauti za usemi katika kiwango cha mazungumzo.
sauti katika mazungumzo yetu zina sauti za chini, za kati na za juu.
Ikiwa mtu amepoteza usikivu, anaweza kusikia sauti fulani za hotuba na sio zingine. Hii inafanya kuwa vigumu kuelewa kile mtu anachoongea.
Kupotea kwa usikivu kunapoongezeka inakuwa vigumu zaidi kusikia mazungumzo yanayofanyika kwa sauti ya kawaida.
Viwango vya Kupoteza usikivu
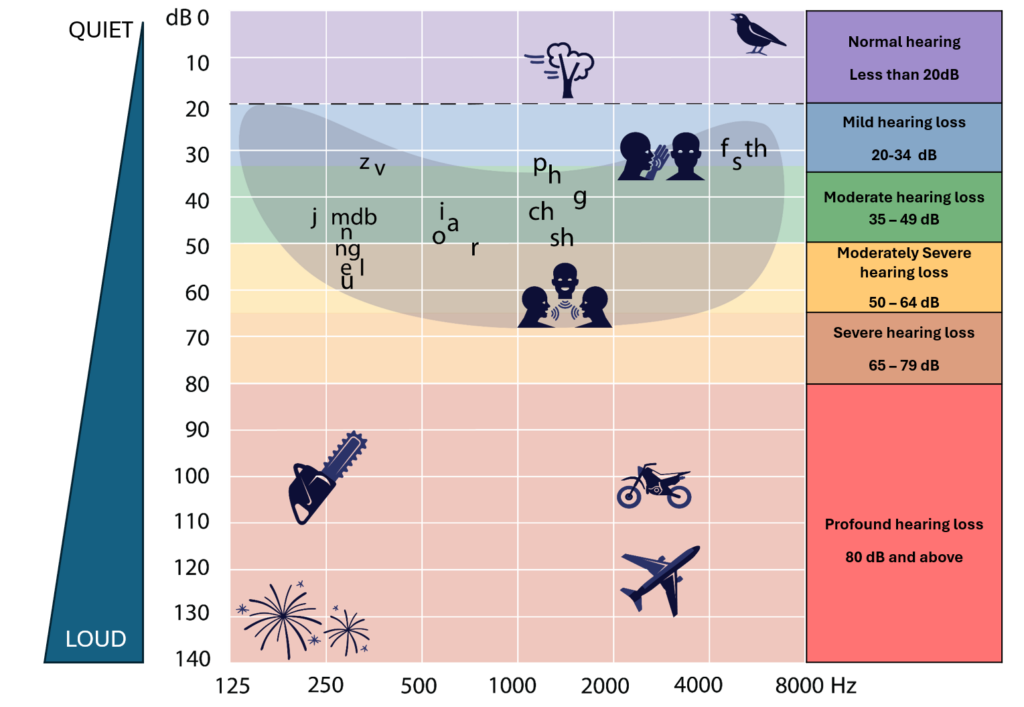
Watu waliopoteza usikivu hawawezi kusikia kama vile watu wenye usikivu wa kiwango cha kawaida.
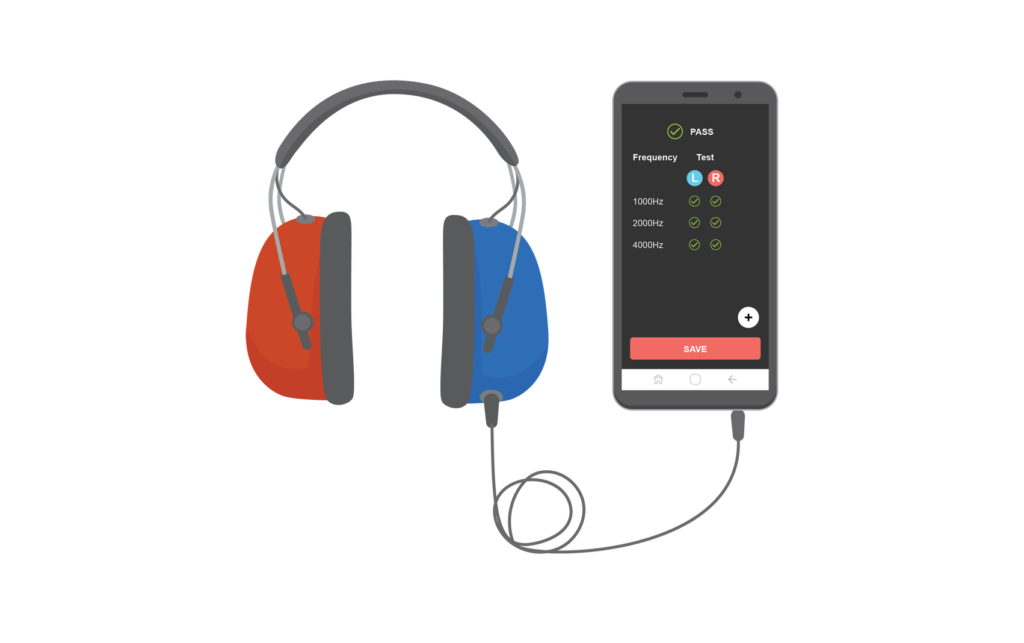
Matokeo ya kipimo cha kusikia yanaweza kupangwa hadi viwango sita tofauti kwa kila sikio. Alama hizo zinatokana na viwango vya wastani vya usikilizaji kwa kila sikio:
- usikivu wa kawaida
- Kupoteza kusikia kwa kiwango kidogo
- Kupoteza usikivu kwa kiwango cha wastani
- Kupoteza usikivu kwa kiwango kikubwa hadi cha wastani
- Kupotea kwa usikivu kwa kiwango kikubwa
- Kupotea kwa usikivu kwa kiwango kikubwa zaidi
UnamKumbuka John?
John alistaafu baada ya kufanya kazi katika kiwanda chenye kelele kwa miaka 34.
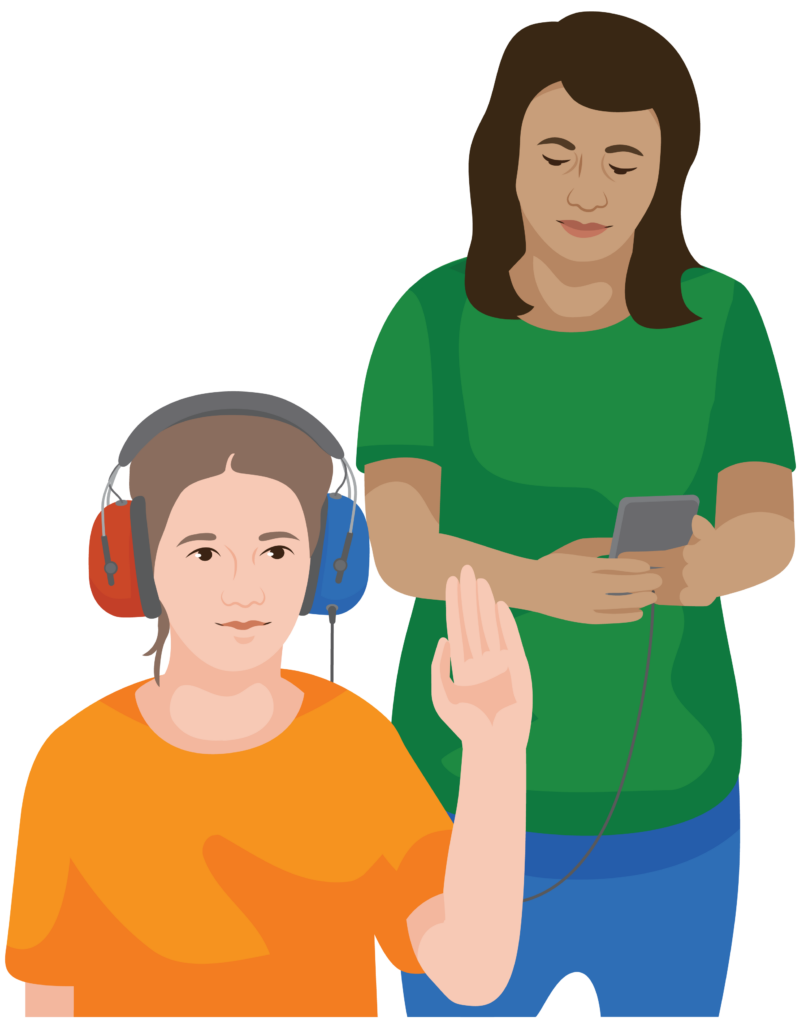
Amefanya kipimo cha usikivu katika kituo cha kutolea huduma ya afya kilichopo eneo analoishi. Mhudumu wa afya anamwonyesha John majibu yake ya vipimo vya usikivu na kumueleza kuwa amepoteza usikivu katika masikio yote mawili.
Mhudumu wa afya anaeleza kwamba John anapata shida kusikia mazungumzo.
Maelekezo
Jifunze jinsi ya kukokotoa Wastani wa viwango vidogo kabisa vinavyoweza kusikika katika somo la pili.